Research Article | | Peer-Reviewed

Recycling of Waste Plastic PET on Asphalt Concrete (AC) by Using Application of Response Surface Methodology: Effect of PET on AC Formulated by Duriez Model

Received: 16 May 2024    Accepted: 3 June 2024    Published: 19 June 2024
Views:       Downloads:
Abstract

The wet recycling process of plastic waste was used to design a composite material (asphalt concrete) following the Duriez method. This process aims to improve the rheological performance of asphalt concrete by transforming PET on powdery and added to bitumen. To attend this objective, Doehlert' surface plane was used to assess how the asphalt rate, the PET rate and size, and then the aggregate rate affected the stability (wet and dry) and, in turn, the immersion/compression strength index (RI/C), the absorption capacity, the compactness as well as the void that could be filled by the 0/10 AC (asphalt concrete). All quadratic multivariate polynomial models with interactions were obtained and validated in order to optimize the responses. Thus, the physical characterization made it possible to obtain an asphalt concrete with good mechanical characteristics. In addition, it was observed that the selected factors had a different impact on the responses, which are: IR/C; the water absorption capacity, compactness and void filled by the binder by significantly increasing or decreasing them in simple, quadratic and interaction contributions. From the multi-response optimization, the objective was to obtain a composite material (Asphalt-PET-Aggregates) with has the best rheological characteristic, resulted in the following compromise: Bitumen rate 7%, PET 6% of asphalt, PET size 0,5mm; Aggregate content 93%. The simulated optimal values yielded the following responses were: 0.77 RI/C, immersion/compressive strength (Y.RI/C); 2.9%, absorption capacity (Y.WAC); 94%, compactness (Y.C); 71% void filled by asphalt (Y.VFA)

Published in International Journal of Materials Science and Applications (Volume 13, Issue 3)
DOI 10.11648/j.ijmsa.20241303.13
Page(s) 48-60
Creative Commons

This is an Open Access article, distributed under the terms of the Creative Commons Attribution 4.0 International License (http://creativecommons.org/licenses/by/4.0/), which permits unrestricted use, distribution and reproduction in any medium or format, provided the original work is properly cited.

Copyright

Copyright © The Author(s), 2024. Published by Science Publishing Group

Keywords

Wet Process, PET-modified Bitumen, Asphalt Concrete 0/10, Duriez, Rheological Characteristic, Optimization

1. Introduction
The emergence of a country requires the development of its road infrastructure, which is essential for the growth of its economy. To have easy access to health care, education, employment and trade, we need pavements of good quality. The road structure (pavement) is made by superimposing at least three layers (base, foundation and surface course) of various construction materials that jointly guarantee the mechanical durability of the structure and the comfort of the asphalt mix . Asphalt mixes are designed for a long period of life and can be degraded from their surface course by pull-out and movement of material . There are many reasons for this phenomenon, the main cause of which is asphalt, the hydrocarbon and excellent road binder derived from crude oil. Indeed, pure asphalt heated during high-temperature can lose its viscosity, which favors the migration of its particularly polar constituents (asphaltenes) at the interface of the mixture by forming bonds with the components likely to end up on the surface of the aggregates, which can increase the decohesion of the latter. Similarly, the presence of water is a factor that undermines the contact between asphalt and aggregates. This is due to the fact that there is a strong interaction between water and aggregates . For all these reasons, the need to improve the performance of materials used in the surface layer is the subject of many reflections around the world . Thus, experiments have shown that the improvement of the properties of asphalt and, in turn, concrete asphalt can be achieved by the addition of waste polyethylene terephthalate (PET) polymer . This drastically reduces the proliferation and harmful effects of this waste on the environment.
Although such a process requires small plastics , little research has highlighted the effect of the latter on the expected properties of asphalt concrete. It is in this respect that this chapter aims, on the one hand, to improve the physic and chemical characteristics of a 0/10 AC (asphalt concrete) based on the Duriez method and, on the other hand, to determine the optimal condition of the mixture by varying the parameters of the concrete asphalt using the methodology of surface response (RSM), particularly Doehlert experience.
2. Materials and Methods
2.1. Materials
The using of PET in the improvement of the rheological properties of asphalt mix (AC 0/10) required the use of several materials:
Asphalt (with: specific gravity 1,03, penetrability 60/70, softening point 46°C and flash point 235°C),
Powdery PET with different sizes 0-0.07mm, 0.07-0.32mm and 0.32-0.56mm and,
Crushed gravel (aggregate) in proportion fillers, G0/4mm, G4/6mm and G6/10mm.
To enter into the composition of the formulation, all aggregates have undergone a characterization in accordance with the various specific tests (bulk and specific density, Los Angeles, water Micro-Deval and flattening coefficient) whose data are listed in the following table.
Table 1. Physical characteristics of aggregates.

Characteristics

Aggregates

Specification Limits

Filler

G 0/4mm

G 4/6,3mm

G 6,3/10mm

Specific gravity (g/cm³)

1.50

1.50

1.30

1.25

-

Bulk density (g/cm³)

2.7

2.50

2.55

2.57

-

Los Angeles (%)

21.54

23.34

˂30

Water Micro-deval (%)

14.44

9.58

˂20

Flattening coefficient (%)

19.11

19.21

˂20

Then, in order to determine the acceptable proportions of aggregates, a particle size analysis of the materials involved is carried out as shown in Table 2.
Table 2. Series of sieves used and theoretical optimal particle size.

Sieve opening (mm)

12, 5

10

8

6,3

5

4

3,15

2

1

Passers-by (%)

99,4

93,86

78,16

62,79

47,41

29,70

25,67

19,90

13,90

Sieve opening (mm)

0,63

0,315

0,25

0,16

0,08

Passers-by (%)

10,58

7,45

6,53

4,78

3,05

Table 3. Concrete asphalt AC 0/10 particle size spindle.

Sieve (mm)

Sieve (mm)

Spindle (%)

10

94

88

100

6,3

63

60

100

2

30

25

75

0,2

20

6

25

0,08

3

3

7

The series of sieves used is that of the AFNOR P18-560 standard, the openings and the different percentages of theoretically expected rejections are recorded in Table 2. The tracing of the curve requires a particle size zone specific to the type of bituminous concrete to be designed (Table 3).
Table 4. Granular fraction.

Fraction

Constituents (%)

Fillers

2

Gravel 0/4

25

Gravel 4/6,3

33

Gravel 6,3/10

40

Total

100

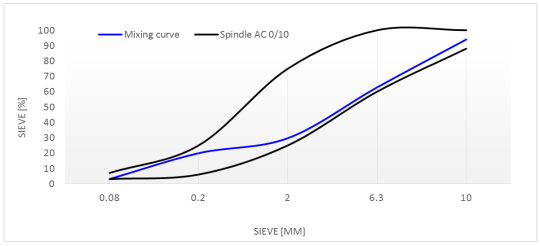
Figure 1. Particle size of the aggregate mixture used and its position in relation to the recommendations of road standard P 18-560.
The aggregates used in the final form come from the reconstitution of the three gravels 0/4 mm, 4/6.3 mm and 6.3/10 mm (Table 4). This reconstruction is carried out based on the particle size zone recommended by the P18-560 standard. It can be observed that the particle size of the resulting aggregate is indeed well integrated within the normative spindle (Figure 1). This aggregate comprises, in weight proportions, 2% fillers, 25% 0/4 aggregate, 33% 4/6.3 mm aggregate and 40% 6.3/10 mm aggregate as shown in Table 4. Based on the knowledge of this weight composition and the bulk densities of the different aggregates summarized in Table 1, we can easily determine MVRG which is the actual density of the entire mixture of granular fractions. The MVRG was obtained as a function of the specific density of the aggregates composing the granular mixtures and the weight proportions obtained from the particle size analysis. It is calculated from the following relationship.
MVRG=ρs1Pop1+ ρs2Pp2+ ρs3Pop3+.100(1)
With: ρs bulk density, POP (percentage by weight)
2.2. Methods
The wet process was used here to analyse the effect of PET on the rheological properties of concrete asphalt formulated according to the Duriez model. On the one hand, this method requires the incorporation of a percentage of PET into the bitumen by mass substitution, which is the principle of obtaining a modified bitumen. On the other hand, the modified bitumen thus obtained is mixed with the aggregates at various granular rates and proportions to obtain asphalt.
2.2.1. Duriez Formulation
The principle of an asphalt formulation containing a modified binder is first the mixture between liquefied bitumen and PET and then the addition of the modified asphalt to the heated aggregates. This formulation defines the dosage of the various constituents capable of achieving and ensuring, during the life of the structure carried out, the maintenance of the properties of use at a satisfactory level, determining the laboratory characteristics of the mixture studied and serving as a basis for the design of a pavement .
The concrete asphalt (AC) containing PET polymer-modified binder, the subject of this study was formulated using the Duriez test methodology. The purpose of such a test was to determine, on the one hand, for a given temperature and compaction, the water resistance of a hydrocarbon mixture from the ratio of compressive strengths with and without immersion of the specimens, and on the other hand, to determine the percentage of voids in the hydrocarbon mixture under specific compaction conditions. This method was therefore an asset for our study framework, in so far, as the presence of PET in the asphalt undoubtedly makes it possible to assess the water resistance of the asphalt concrete designed. In addition, the formulation of asphalt concrete was generally based on the determination of essential parameters such as the specific surface area of the aggregates as well as the binder content likely to ensure the cohesion of the aggregates.
2.2.2. Specific Surface
The specific surface area of aggregates refers to the actual surface area of the aggregates. Knowledge of such a characteristic of aggregates is important, it provides information on the absorption capacity of a body. Indeed, the larger the specific surface area of a body, the more its adsorption capacity increases, which can thus increase the exchange surface . The specific surface was determined by the following formula .
100 β=0.25g+2.3S+12s+135f (2)
According to the data (Table 2) obtained from the particle size analysis, we have:
100 β = 0.25 (100-62.79) + 2.3 (62.79-7.45) + 12 (7.45-3.05) + 135 (3.05)
β=6.01m²/kg
With: β the specific surface area of the grains, g is the percentage of grains with diameters greater than 5 mm, s is the percentage of grains with diameters between 0.315 mm and 5 mm, s is the percentage of grains with diameters between 0.08 mm and 0.315 mm and f is the percentage of grains with diameters less than 0.08 mm.
2.2.3. Calculation of the Binder Rate
The determination of the binder content (TL) is carried out according to the formula below (3). It was obtained on the basis of the values of the classical relevant parameters of the binding richness modulus K, the specific surface area and the MVRG.
TL=K.Φβ5(3)
With, ø (Correction coefficient) = Standard absolute density of aggregates/MVRG.
Soø=2.65/MVRG(4)
The binder content is deduced from the previous formula (3) by substituting the value of the richness modulus K. In general, K is between 3.5-4 . However, asphalt concrete usually contains 5-8% bitumen . In addition, although this method allows for the production of a good quality asphalt mix with required compliance requirements such as resistance to deformation or rutting and resistance to fatigue or thermal cracking, it has some limitations.
Indeed, by this process, it is difficult to predict succinctly, for example, the influence of the rate and size of powdery PET plastic waste on the mechanical characteristics sought by the Duriez formulation. Thus, the use of response surface plans (RSM) was a necessity. Used in almost all process domains, these designs make it possible to highlight the effects of mixing parameters (X) on the expected properties of the formulated matrix (Y).
2.2.4. Response Surface Methodology
Optimization studies using response surface methodology (RSM) were deeply investigated . Furthermore, the optimum conditions could assist designers to manufacture simple unit operations that could limit or eliminate the tedious practice of recycling PET on concrete asphalt (rate of bitumen and waste PET, rate of aggregate and PET size). RMS is a collection of mathematical and statistical technique that is useful for modelling and analysing situations in which a response of interest is influenced by several variables, especially if there is a need to optimize the responses of a process. Doehlert matrix as an experimental design represents a uniform distribution of experimental points in space of coded variables as shown on table 5. To get the best condition of using RSM we need:
The coefficient of determination (R²), which could draw to investigate the adequacy of the proposed models and the absolute average deviation (AAD) calculated by following formula,
AAD=i=1n(/Yi,exp- Yi, theo/Yi, exp)n(5)
- Bf (bias facto) and Af (accuracy factor) coefficients, determined from equation 6 and 7,
Bf=101/ni=1n   log(Yi, theo   Yi, exp)(6)
Af=101/ni=1n   /log(Yi, theo   Yi, exp)/    (7)
- AAD, absolute average deviation, Bf, bias factor, Af, accuracy factor, Yi, Theo, response obtained using
the model, Yi, exp, response obtained via experiment and n, number of trials.
Table 5. Doehlert experimental design of four independent variables employed to recycle PET on AC.

Coded values

Uncoded values

x1 (%)

x2 (%)

x3 (%)

x4 (mm)

X1 (%) Asphalt

X2 (%) Aggregate

X3 (%) PET ratio

X4 (mm) PET size

1

0

0

0

0

6,5

93,50

6,00

0,32

2

1

0

0

0

8,00

93,50

6,00

0,32

3

-1

0

0

0

5,00

93,50

6,00

0,32

4

0,5

0,866

0

0

7,25

94,80

6,00

0,32

5

-0,5

-0,866

0

0

5,75

92,20

6,00

0,32

6

0,5

-0,866

0

0

7,25

92,20

6,00

0,32

7

-0,5

0,866

0

0

5,75

94,80

6,00

0,32

8

0,5

0,289

0,816

0

7,25

93,93

10,90

0,32

9

-0,5

-0,289

-0,816

0

5,75

93,07

1,10

0,32

10

0,5

-0,289

-0,816

0

7,25

93,07

1,10

0,32

11

0

0,577

-0,816

0

6,50

94,37

1,10

0,32

12

-0,5

0,289

0,816

0

5,75

93,93

10,90

0,32

13

0

-0,577

0,816

0

6,50

92,63

10,90

0,32

14

0,5

0,289

0,204

0,791

7,25

93,93

7,22

0,56

15

-0,5

-0,289

-0,204

-0,791

5,75

93,07

4,78

0,07

16

0,5

-0,289

-0,204

-0,791

7,25

93,07

4,78

0,07

17

0

0,577

-0,204

-0,791

6,50

94,37

4,78

0,07

18

0

0

0,612

-0,791

6,50

93,50

9,67

0,07

19

-0,5

0,289

0,204

0,791

5,75

93,93

7,22

0,56

20

0

-0,577

0,204

0,791

6,50

92,63

7,22

0,56

21

0

0

-0,612

0,791

6,50

93,50

2,33

0,56

x: coded value of variables and X: the real value of variables.
2.2.5. Designs of Duriez Specimens
Duriez specimens are designed in accordance with the NF-P 98-250-1 standard. It was made of a modified bitumen mixture and aggregates at well-defined rates, of which 1000 g of this set is poured into the specific Duriez mould. The mixing conditions are specified in Table 5 and as shown in the diagram in Figure 2. Indeed, to obtain a good asphalt mix, the bitumen modified with PET was heated to around 154°C for 22 minutes and then added to the aggregates probably heated between 150-170°C. The mixture is kneaded for at least 30 minutes to ensure a good homogenization of the medium Thus, the formulated bituminous concretes are poured into the molds. Then, these molds are placed on the press where a pressure of 60 KN was applied and maintained for 5 min. Afterwards, the specimens are removed from the mould after a complete cooling (about 4 hours). In addition, they are numbered, to be weighed, and then their geometrical measurements are carried out using a 1/10 mm caliper, this makes it possible to control the manufacture of the specimens and determine their bulk density by calculation.
Thus, 5 specimens are designed for each test, including:
Two (2) are kept in the air for 7 days, in order to be subjected to the simple compression test to obtain their maximum strength or stability in dry conditions (RC).
Two (2) are immersed in water at 18°C for 7 days to determine their maximum wet or immersion resistance (IR),
One (1) is used to inquire about the bulk density at hydrostatic weighing.
The load applied for compression tests is at a speed of 1 mm/s, until the moment of failure. The compressive strength according to this Duriez test is obtained by dividing this load (the breaking force) in Kg by the surface area of the specimen, i.e. 50 cm² in the case of the normal Duriez test (our study framework) and 113 cm² in the case of the dilated Duriez test. This resistance must be greater than 60 kg/cm² or 60 bar. Thus, the samples from the Duriez formulation made allow us to determine several parameters that provide information on the quality of an asphalt concrete, namely: immersion/compressive strength (RI/C), water absorption capacity (WAC), compactness (C) and void filled by asphalt (VFA).
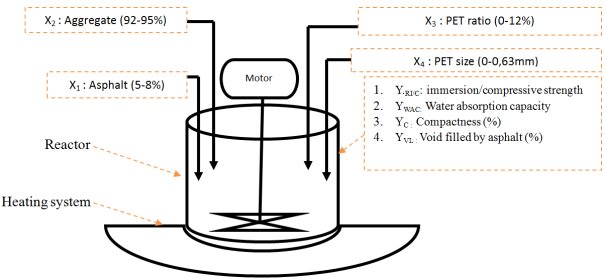
Figure 2. Production of asphalt concrete containing PET.
2.3. Characterization of Concrete Asphalt
2.3.1. Immersion/Compressive Strengths Ratio
The RI/C studies the resistance to water immersion compared to compression of the hydrocarbon mixture tested. This ratio, calculated from formula (8), provides information on the ability of a mixture to remove coatings in the presence of water. In general case, when the RI/C coefficient tends to 1, it indicates that the asphalt concrete has good stability in air as well as after immersion. In principle, the proper formulation of an asphalt concrete requires an IR/C˃ 0,75 .
RI/C=RIRC(8)
2.3.2. Calculation of Water Absorption Capacity
The WAC makes it possible to assess the water resistance of the asphalt. Indeed, aggregates have voids or cracks (internal porosity) that can allow water infiltration. When these internal voids are large, then asphalt concrete can be more frosty and therefore vulnerable to degradation in the presence of water, despite the presence of bitumen, which is supposed to be impermeable under certain given conditions. The determination of the WAC is done by the following relation:
CAB=100*P3P1(9)
With: P1, was the weight of the sample before immersion, P2, was the weight of the specimen after immersion and P3=P2-P1, the weight of water absorbed by the specimen after 7 days of immersion.
2.3.3. Determination of Compactness (C)
The compactness of asphalt concrete was defined as the ratio between the bulk density (MVR) of the solid elements and the apparent volume (MVA) of the concrete they represent. It provides information on the behaviour and arrangement of the aggregates in the specimen. In fact, the increase in compactness allows the grains to come closer together, which reduces the residual voids (RV) that may exist between them, so that the concrete becomes compact and more resistant. Determination of compactness requires knowledge of MVA and MVR. It is obtained from the following formula.
C=100*MVAMVR(10)
The MVA was determined in two ways: the calculated method and the measured method. The MVR was calculated from the following relationship:
MVR= 100+TLTLDb+ Pop1ρ1+ Pop2ρ2+Pop3ρ3+(11)
With: ρs1, ρs2, ρs3.... specific weights of the different aggregates used in the composition of the mixture, pop1, pop2, pop3... percentage by weight of the aggregates used in the mixture, and Db, the density of the bitumen and TL, the rate of the binder.
2.3.4. Determination of Voids Filled by Asphalt (VFA)
The VFA represents the intergranular space that can be filled by the binder. It is obtained based on the residual void (RV) of the vehicle (12). Indeed, when the void filled by the binder is small, it implies that there is not enough bitumen to compensate for the many spaces between the aggregates (RV increases). This can have an impact on the stability of asphalt concrete, as long as one too many RV reduce compactness and expose it to cracking and even rutting (13).
VFA is determined based on VR and V, as follows:
VFA=(V-RV)V*100 (12)
With:
RV (Residual Void), which is computed by the relation
RV=100-C(13)
And V (Void occupied by air and asphalt), V was determined by the following equation:
V=100*(MVRg-MVAg)MVRg,(14)
Where:
MVAg was the bulk density of the aggregates in the specimen.
MVAg=MVA*(1-PL100+PL)(15)
And PL is the weight of the binder.
2.4. Optimization Condition
The response surface methodology using Doehlert experimental matrix was used to optimize recycling of PET on asphaltic road. Minitab version 19, Sigma Plot version 14.5 and Excel, were used for statistical analysis, regression models and graphical optimization. Besides, the fit of models was verified by the coefficient of determination (R²), the absolute average deviation (AAD), Bf (Bias Factor) and Af, (Accuracy Factor). Four independent variables namely Asphalt (X1: 5-8%), Aggregate (X2: 92-95%), PET ratio (X3: 0-12%) and PET size (X4: 0-0,63 mm) were chosen. The ranges of independent parameters were selected based on literature review and preliminary studies. Twenty-one different experiments were presented in according to the experimental design for the four parameters. The experiments were figured in coded (x) and real (X) values. The response functions (Yi) measured were Water absorption capacity (Y.WAC), Immersion/Compression Resistant (Y. IR/C), Compactness (Y. C), and Void filled by Asphalt (Y.VFA). The responses were related to the coded values (xi) by the second order polynomial that shown in equation 16.
Yi=bo+i=1   kbiXi+i=1kbiiXi2+i=1k-1*j=i+1kbijXiXj  (16)
The coefficients of the polynomial were represented by b0 (constant term), bi (linear effects), bii (quadratic effects) and bij (interaction effects). Xi and Xj are the independent variables. The analyses of variance were generated and the effect and regression coefficients of individual, quadratic and interaction terms were determined. The significances of all terms in the polynomial were judged statistically at a probability (P) of lower than 0.05 (P<0.05). The regression coefficients were then used to make statistical calculation to generate contour map and response surface graphs from the regression models.
2.5. Recycling Procedure
In each experiment of recycling of used plastic in Duriez Method, 1000 g of mixed of the cooked sample was introduced Duriez Tube of a known weight and then pressed. Certain of specimen were deformed and other were kept to get information about: Water absorption capacity (WAC, %), IR/C, Compactness range (C, %) and Void Filled by Asphalt (VFA, %).
Table 6. Influences of Asphalt and PET ratio, mixing temperature and mixing time on the responses of modified binder.

Asphalt (%) X1

Aggregate (%) X2

PET (%) X3

PET (mm) X4

IR/C

WAC (%)

VFA (%)

C (%)

1

6,5

94

6

0,32

0,62

2,80

89

98

2

8

94

6

0,32

0,76

2,70

65

92

3

5

94

6

0,32

0,83

2,80

58

92

4

7,25

95

6

0,32

0,62

2,60

68

93

5

5,75

92

6

0,32

0,81

2,30

56

91

6

7,25

92

6

0,32

0,80

2,50

68

93

7

5,75

95

6

0,32

0,79

2,30

56

91

8

7,25

94

11

0,32

0,77

2,80

58

90

9

5,75

93

1

0,32

0,95

3,50

59

92

10

7,25

93

1

0,32

0,80

3,50

74

95

11

6,5

94

1

0,32

0,80

3,30

69

94

12

5,75

94

11

0,32

0,79

2,80

47

88

13

6,5

93

11

0,32

0,81

2,70

55

90

14

7,25

94

7

0,56

0,83

3,00

66

93

15

5,75

93

5

0,07

0,86

3,00

59

92

16

7,25

93

5

0,07

0,80

3,00

72

95

17

6,5

94

5

0,07

0,90

3,00

67

94

18

6,5

94

10

0,07

0,75

2,50

56

90

19

5,75

94

7

0,56

0,89

2,70

51

89

20

6,5

93

7

0,56

0,90

2,50

56

90

21

6,5

94

2

0,56

0,78

2,60

57

91

3. Results and Discussions
The actual values obtained from the Doehlert matrix and experimental values of the responses are presented in Table 6. Applying multiple regression analysis using Minitab software, taking into account the experimental results presented in Table 7, the following polynomial mathematical models explain the variations in expected responses. In addition, equations 17, 18, 19 and 20 which describe the effects of our illustrated models:
Y.RI/C=0,6200 - 0,0610 x1 - 0,0500 x2 - 0,0375 x3 + 0,0180 x4 + 0,1750 x1*x1 + 0,1622 x2*x2
+ 0,3396 x3*x3 + 0,3920 x4*x4 - 0,1067 x1*x2 + 0,1377 x1*x3
+ 0,0060 x1*x4+ 0,0182 x2*x3 - 0,1506 x2*x4 + 0,2981 x3*x4(17)
Y.WAC=2,800 + 0,0600 X1 + 0,0533 X2 - 0,4556 X3 - 0,1399 X4 - 0,050 X1*X1
- 0,645 X2*X2+ 0,877 X3*X3 - 0,048 X4*X4 + 0,067 X1*X2 - 0,025 X1*X3
+ 0,220 X1*X4 + 0,084 X2*X3+ 0,120 X2*X4 + 1,440 X3*X4(18)
Y.VFA=89,41 + 9,15 x1 + 0,58 x2 - 9,69 x3 - 4,70 x4 - 28,22 x1*x1 - 36,37 x2*x2
- 44,62 x3*x3- 46,07 x4*x4 + 0,00 x1*x2 - 3,04 x1*x3 + 1,85 x1*x4
- 4,21 x2*x3 + 2,63 x2*x4+ 10,98 x3*x4(19)
Y.C=98,39 + 1,713 x1 + 0,143 x2 - 3,105 x3 - 1,451 x4 - 6,42 x1*x1
- 8,18 x2*x2 - 10,88 x3*x3- 10,76 x4*x4 + 0,00 x1*x2 - 0,38 x1*x3
+ 0,75 x1*x4 - 1,35 x2*x3 + 0,97 x2*x4+ 3,17 x3*x4(20)
Table 7. Regression coefficients, coefficient of determination (R²), absolute average deviation (AAD), bias factor (Bf) and accuracy factor (Af) for the four responses of PET recycling on asphalt concrete.

Termes

IR/C

WAC

VFA

C

Probability

Constante

0,000

0,000

0,000

0,000

X1-Asphalt (%)

0,010

0,406

0,012

0,004

X2-Aggregates (%)

0,039

0,517

0,806

0,813

X3-PET (%)

0,112

0,001

0,002

0,008

X4-PET size (mm)

0,420

0,150

0,055

0,115

X1*X1

0,008

0,795

0,003

0,002

X2*X2

0,036

0,039

0,004

0,003

X3*X3

0,002

0,017

0,001

0,001

X4*X4

0,001

0,869

0,002

0,002

X1*X2

0,073

0,750

1,000

1,000

X1*X3

0,056

0,919

0,831

0,685

X1*X4

0,926

0,421

0,695

0,817

X2*X3

0,796

0,770

0,519

0,627

X2*X4

0,081

0,696

0,662

0,776

X3*X4

0,008

0,004

0,208

0,286

0,94

0,94

0,94

0,93

AAD

0,02

0,03

0,00

0,03

Bf

1,00

1,00

1,00

1,03

Af

1,02

1,03

1,0

1,00

Analyses of variance were generated and the terms of the polynomials judged to be statistically acceptable have a probability (P) of less than 0.05. The regression coefficients were then used to perform statistical calculations to generate graphical and response surface contours from the resulting regression models.
3.1. Model Validation
The results of the analysis of variance, suitability of the models is summarized in Table 7. The data showed a good fit based on the equation, which statistically determines the acceptability conditions with a P < 0.05. The values of the coefficient of determination (R²) for RI/C, WAC, VFA and C are 0.94 respectively, 0.94, 0.93 and 0.94.
These values are satisfactory because, on the one hand, the closer the value of R² is to 1, the better the empirical models are . Similarly, it has been suggested that, for a good fit of a model, R² should be at least greater than 0.8 . On the other hand, the mean absolute deviation (AAD), bias factor (Bf), and accuracy factor (Af) should include the range of 0 to 0.3, 0.75-1.25 and 0.75-1.25 respectively . According to Table 7, the values of RI/C, WAC, VFA and C confirm the suitability of the models. Thus, the models could be used to generate surface response curves to explain the influence of independent factors on the responses studied.
3.2. Impacts of Parameters (X) on Expected Responses (Y)
3.2.1. Water Absorption Capacity
The water absorption capacity (WAC) of asphalt concrete 0/10 decreased significantly when the aggregate content (P=0.039 Table 7) and the PET rate (P=0.004 Table 7) increased by 92-95% and 0-12% respectively (Figure 3). Essentially, the reduction in the water absorption capacity of asphalt concrete makes sense since the presence of plastic in the bitumen further strengthens the water resistance of the latter. This is because polymers are naturally impermeable to water. Their presence improves the heat resistance of asphalt concrete, which means that at the right temperature, PET is likely to form a putty phase with the fillers of the aggregates to prevent water infiltration between the pores of larger aggregates .
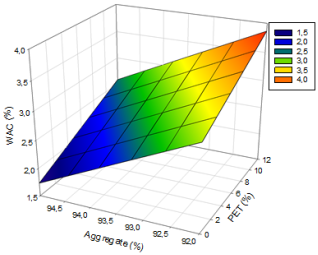
Figure 3. Effect of aggregate and PET ratio on WAC.
The x3 x4 interaction (PET rate and size) significantly increases (P=0.004, Table 7) the WAC of asphalt concrete. In fact, this effect was simultaneously accentuated by an increase in the size of PET as well as their rates. When the size and PET content was 0.315 mm and 6% respectively (Figure 4), the WAC gets a value of 3%, on the other hand, increasing the PET content to 12% and its size to 0.63 mm increases the WAC to 3.6%.
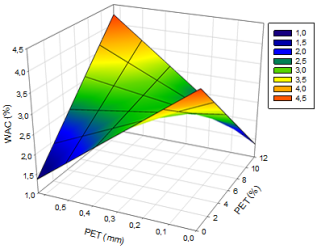
Figure 4. Interaction effect of PET size And Ratio on WAC.
Essentially, when the size of PET is large, the specific surface area of the bitumen and therefore of the asphalt concrete remains small, which disadvantages the distribution of PET in the mixture, leading to a significant absorption of water in the concrete. On the other hand, the reduction of the size of PET and the increase in its rate, promotes the distribution of PET in the concrete by reducing the WAC. This phenomenon illustrates that the good distribution of small particle size PET makes bitumen consist of the effect of further reducing its permeability to water, which in turn reduces the capacity of asphalt concrete to absorb water.
3.2.2. The Immersion/Compression Stability Ratio
The ratio of immersion/compression stability of asphalt concrete (RI/C or IR/C) 0/10 increased significantly when the bitumen ratio (P=0.010, Table 7) and the aggregate ratio (P=0.039, Table 7), increased by 5-8% and 92-95% respectively (Figure 5). This increase clearly shows that the pre- and post-immersion stability of asphalt concrete increases with increasing quantity of bitumen and proportionally the quantity of aggregates. On the other hand, it is obvious that the decrease in the bitumen content and the increase in the aggregate rate reduces the stability and therefore the RI/C because the quantity of the bituminous binder would be insufficient to allow the aggregates to adhere to each other. This can easily lead to the decohesion of the aggregates. In addition, the increase in the bitumen content and the decrease in the aggregate content would make the concrete soft and very sensitive to pressure and heat, which would undoubtedly reduce its RI/C.
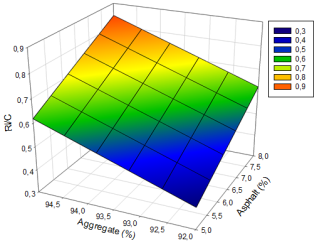
Figure 5. Evolution of IR/C as a Function of Aggregate and asphalt ratio.
The x3 x4 interaction (PET rate and size) significantly increases (P=0.008, Table 7) the RI/C of asphalt concrete. In fact, this effect was simultaneously accentuated by an increase in the size of PET as well as their rates. When the PET size and PET content are 0.315 mm and 6% respectively (Figure 6), the IR/C assumes a value of 0.6. At the same time, increasing the PET content to 12% and its size to 0.63 mm increases the compressive and immersion strength by increasing the RI/C to 0.9. This phenomenon is probably due to the increase in the consistency of the asphalt by the addition of PET, which has the effect of improving the hot resistance of the latter and in turn improving the stability of the asphalt concrete thus designed. Indeed, a very consistent bitumen promotes the hot coating of the aggregates, without causing a break in the bonds of their molecules. In addition, temperature plays a key role in the coating of aggregates. This is because it allows the bitumen to be less viscous in order to completely wet the heated aggregates together. Similar results have been recorded . However, while increasing the size also increases the stability of the concrete, it makes the asphalt concrete more sensitive to water.
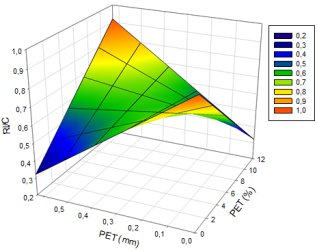
Figure 6. Interaction effect of PET size and ratio on RI/C.
3.2.3. Compactness Range
Bitumen (P=0.012, Table 7) and PET (P=0.002, Table 7) had a significant impact on the compactness of bituminous concrete 0/10 when their respective rates increased by 5-8% and 0-12% (Figure 7).
The compactness of asphalt concrete drops significantly as the bitumen content in the mix increases.
While the increase in the bitumen content has the effect of facilitating the adhesion of the aggregates as a whole, in order to obtain a compact specimen, the increase in the PET content has a negative impact on the compactness of the bituminous concrete, given the intrinsic properties of the polymers. In fact, plastics are difficult to compact because of their plasticity. In concrete, they tend to reduce the bulk density (MVA) of the specimen due to the effect of Archimedean thrust. However, the reduction in density reduces the compactness of the mixture by increasing the residual void (10). This trend has been documented and quantified in various articles . In addition, residual voids are pockets of air that form between the particles of the compacted mixture. Their presence is necessary to allow additional compaction of the pavement in the direction that they are likely to contain binder. In general case, the acceptable residual void rate is 2 to 4%.
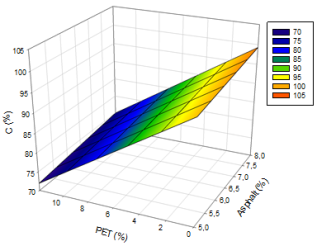
Figure 7. Evolution of compactness as a function of PET and asphalt ratio.
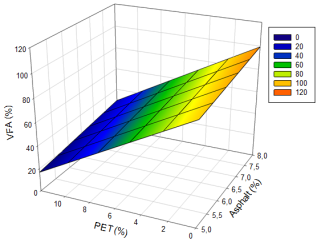
Figure 8. Evolution of the VFA as a function of PET and asphalt ratio.
3.2.4. Void Filled by Binder
The void filled by the asphalt (VFA) of AC 0/10 decreased significantly when the bitumen (P=0.004, Table 7) and PET (P=0.008, Table 7) increased by 5-8% and 0-12% respectively (Figure 8). This phenomenon derives its logic from the fact that the increase in the PET content decreases the compactness and obviously creates more of the residual void in the asphalt concrete. However, when the RV grows, it leads to the decrease in the VFA. Equation (12) seems to predict the speed of the latter as a function of the RV. In fact, too high an air void content provides an area conducive to the entry of harmful water into the concrete, which seems to reduce its stability and consequently reduces the void that can be filled by the bitumen. However, the VFA is essential to ensure the durability of the concrete, its reduction allows us to conclude that there is little bitumen to over densify the concrete under the effect of traffic and load. This phenomenon has been observed by previous research .
3.3. Optimization
In order to properly recycle plastic waste in the surface layer of bituminous pavements, the powdery PET was incorporated into the asphalt and then mixed with the aggregate to make a 0/10 AC. The role of this technique was to define the optimal condition for the formulation of the formulated composite material. Thus, a graphical optimization was carried out using Minitab, Sigma plot and Excel software. Such a methodology consists of superimposing the contour lines obtained from Doehlert's experimental design according to the specific criteria imposed. The optimum condition has been defined in such a way as to obtain bituminous concrete that meets the technical requirements in accordance with the Duriez formulation, the desired normative qualities of which are mentioned in Table 8.
Table 8. Characteristics of bituminous concrete by the Duriez model (NF P-98 250)

Characteristics

IR/C

WAC (%)

C (%)

VFA (%)

Limits values

≥0,75

≤3

92-94

70-80

To obtain the optimal conditions for the incorporation of PET into 0/10 asphalt concrete, multi-response optimization was performed. WAC, RI/C, C, and VFA are all optimized for this purpose. At the end of this optimization, the trade-off is as follows:
Asphalt content 7% of which 6% PET size 0.5 mm,
Aggregate content 93%.
This combination produced responses as follows:
1) -0.77 RI/C Immersion/Compressive Strength (Y. RI/C),
2) -2.9% Absorption Capacity (Y. CAB),
3) -94% Compactness (Y. C),
4) -71% Void Filled by Asphalt (Y. VFA).
The composite desirability of this study indicates the value of 0.98, which is still closer to 1. On the one hand, this value proves that the parameters seem to produce favorable results for all responses as a whole. On the other hand, individual desirability indicated that responses such as C, VFA, WAC and RI/C were optimized appropriately in terms of the target whose values are 0.98 respectively, 0,99, 0.94 and 0.99.
4. Conclusion
This last part of our work examined the rheological behaviour of asphalt concrete containing a PET modified binder, thanks to the response surface methodology, more precisely via Doehler’s experimental designs. It appeared that the effect of incorporating PET plastic powder into the 0/10 asphalt concrete resulted in the obtaining of a composite material with good characteristics, particularly in terms of water absorption capacity, Duriez stability and, by extension, the immersion/compression stability index, compactness but also the void filled by the binder. Such a result seems to justify the relevance of such a process in order to improve the quality of the surface course and thus increase the service life of the pavements.
Nevertheless, this process has led to a decrease in the compactness of the asphalt concrete manufactured, which results in the excessive increase of the residual void with a reduction in the void rate filled by the binder. These properties are essential to obtain a stable composite material that is resistant to loads and climatic hazards. However, the conditions for obtaining a matrix containing PET with exceptional rates and qualities have been defined. The fact that the desirability of the study composite (0.98) is so close to 1 is sufficient evidence that the parameters appeared to give positive results for all responses taken as a whole.
Abbreviations

PET

Polyethylene Terephthalate

AAD

Average Deviation

Bf

Bias Factor

Af

Accuracy Factor

RMS

Response Methodology Surface

RI/C

Immersion/Compressive Strength

WAC

Water absorption Capacity

AC

Asphalt Concrete

C.

Compactness

VFA

Void Filled by Asphalt

Author Contributions
Hassan Alaguid Ibrahim Sofo: Conceptualization, Data curation, Formal Analysis, Funding acquisition, Investigation, Methodology, Visualization, Writing – original draft, Writing – review & editing
Mohagir Ahmed Mohammed: Supervision, Validation, Visualization, Writing – review & editing
Batran Sidick: Methodology, Validation, Writing – original draft
Conflicts of Interest
The authors declare no conflicts of interest.
References
[1] ALIAPUR. (2013). Surface specifique.
[2] ASCO TP, A. p. (2007). Formulation des enrobés bitumineux. Récupéré sur
[3] Babalghaith, A., Koting, S., Ramli Sulong, N., & Karim, M. (2019). Optimization of mixing time for polymer modified asphalt. IOP Conf. Ser. Mater. Sci. Eng., (pp. 512, 012030.).
[4] Baş D., a. B. (2007). Modeling and optimisation I: Usability of response surface.
[5] Dalgaard, P. &. (1998). Predicted and observed growth of Listeria monocytogenes in seafood challenge tests and in naturally contaminated cold-smoked salmon.. International Journal of Food Microbiology, 40(1-2), 105-115.
[6] Dumont, A. G. (2004). Composants minéraux, Matériaux routiers bitumineux. Tome 1, Editions Lavoisier.
[7] DURIEZ M, A. J. (1959). Liants routiers et enrobés. Editions Dunod et Editions du Moniteur des Travaux Publics,. Paris. 553 p.
[8] E. Ahmadinia, M. Z. (2011). Using waste plastic bottles as additive for stone mastic asphalt, Mater.. Design 32, 4844–4849.
[9] Fengchi Xu, Y. Z. (2022). Using Waste Plastics as Asphalt Modifier: A Review. Materials MDPI, 2.
[10] Hocine, & Hadidane. (2018). Contribution à l'amelioration du comportement des corps de chaussées avec l'utilisation des materiaux recyclés. Thèse de doctorat, 1.
[11] Jassim, H. M., Mahmood, O. T., & Ahmed, S. A. (2014). Optimum Use of Plastic Waste to Enhance the Marshall Properties and Moisture Resistance of Hot Mix Asphalt. International Journal of Engineering Trends and Technology (IJETT), 18-25.
[12] Joglekar A. M., a. M. (1987). Product excellence through design of experiments..
[13] LCPC. (1998). Catalogue des dégradations de surface des chaussées,. Laboratoire Central des Ponts et Chaussées, Méthode d'essai n°52, complément n°38-2,.
[14] Mohagir, A. M. (2010). Optimisation of press extraction and decolourisation of shea (Vitellaria paradoxa Gaertner F.) butter. NGAOUNDERE.
[15] Ramond, G. L. (2004). Adhésion Liant Granulats, Matériaux routiers bitumineux,. Tome 1, Editions Lavoisier.
[16] Vasudevan R, N. S. (2007). Utilization of Waste Polymers for Flexible Pavement and Easy Disposal of Waste Polymers. Proceedings of the International Conference on Sustainable Solid.
Cite This Article
  • APA Style

    Sofo, H. A. I., Mohammed, M. A., Sidick, B. (2024). Recycling of Waste Plastic PET on Asphalt Concrete (AC) by Using Application of Response Surface Methodology: Effect of PET on AC Formulated by Duriez Model. International Journal of Materials Science and Applications, 13(3), 48-60. https://doi.org/10.11648/j.ijmsa.20241303.13

    Copy | Download

    ACS Style

    Sofo, H. A. I.; Mohammed, M. A.; Sidick, B. Recycling of Waste Plastic PET on Asphalt Concrete (AC) by Using Application of Response Surface Methodology: Effect of PET on AC Formulated by Duriez Model. Int. J. Mater. Sci. Appl. 2024, 13(3), 48-60. doi: 10.11648/j.ijmsa.20241303.13

    Copy | Download

    AMA Style

    Sofo HAI, Mohammed MA, Sidick B. Recycling of Waste Plastic PET on Asphalt Concrete (AC) by Using Application of Response Surface Methodology: Effect of PET on AC Formulated by Duriez Model. Int J Mater Sci Appl. 2024;13(3):48-60. doi: 10.11648/j.ijmsa.20241303.13

    Copy | Download

  • @article{10.11648/j.ijmsa.20241303.13,
      author = {Hassan Alaguid Ibrahim Sofo and Mohagir Ahmed Mohammed and Batran Sidick},
      title = {Recycling of Waste Plastic PET on Asphalt Concrete (AC) by Using Application of Response Surface Methodology: Effect of PET on AC Formulated by Duriez Model
    },
      journal = {International Journal of Materials Science and Applications},
      volume = {13},
      number = {3},
      pages = {48-60},
      doi = {10.11648/j.ijmsa.20241303.13},
      url = {https://doi.org/10.11648/j.ijmsa.20241303.13},
      eprint = {https://article.sciencepublishinggroup.com/pdf/10.11648.j.ijmsa.20241303.13},
      abstract = {The wet recycling process of plastic waste was used to design a composite material (asphalt concrete) following the Duriez method. This process aims to improve the rheological performance of asphalt concrete by transforming PET on powdery and added to bitumen. To attend this objective, Doehlert' surface plane was used to assess how the asphalt rate, the PET rate and size, and then the aggregate rate affected the stability (wet and dry) and, in turn, the immersion/compression strength index (RI/C), the absorption capacity, the compactness as well as the void that could be filled by the 0/10 AC (asphalt concrete). All quadratic multivariate polynomial models with interactions were obtained and validated in order to optimize the responses. Thus, the physical characterization made it possible to obtain an asphalt concrete with good mechanical characteristics. In addition, it was observed that the selected factors had a different impact on the responses, which are: IR/C; the water absorption capacity, compactness and void filled by the binder by significantly increasing or decreasing them in simple, quadratic and interaction contributions. From the multi-response optimization, the objective was to obtain a composite material (Asphalt-PET-Aggregates) with has the best rheological characteristic, resulted in the following compromise: Bitumen rate 7%, PET 6% of asphalt, PET size 0,5mm; Aggregate content 93%. The simulated optimal values yielded the following responses were: 0.77 RI/C, immersion/compressive strength (Y.RI/C); 2.9%, absorption capacity (Y.WAC); 94%, compactness (Y.C); 71% void filled by asphalt (Y.VFA)
    },
     year = {2024}
    }
    

    Copy | Download

  • TY  - JOUR
    T1  - Recycling of Waste Plastic PET on Asphalt Concrete (AC) by Using Application of Response Surface Methodology: Effect of PET on AC Formulated by Duriez Model
    
    AU  - Hassan Alaguid Ibrahim Sofo
    AU  - Mohagir Ahmed Mohammed
    AU  - Batran Sidick
    Y1  - 2024/06/19
    PY  - 2024
    N1  - https://doi.org/10.11648/j.ijmsa.20241303.13
    DO  - 10.11648/j.ijmsa.20241303.13
    T2  - International Journal of Materials Science and Applications
    JF  - International Journal of Materials Science and Applications
    JO  - International Journal of Materials Science and Applications
    SP  - 48
    EP  - 60
    PB  - Science Publishing Group
    SN  - 2327-2643
    UR  - https://doi.org/10.11648/j.ijmsa.20241303.13
    AB  - The wet recycling process of plastic waste was used to design a composite material (asphalt concrete) following the Duriez method. This process aims to improve the rheological performance of asphalt concrete by transforming PET on powdery and added to bitumen. To attend this objective, Doehlert' surface plane was used to assess how the asphalt rate, the PET rate and size, and then the aggregate rate affected the stability (wet and dry) and, in turn, the immersion/compression strength index (RI/C), the absorption capacity, the compactness as well as the void that could be filled by the 0/10 AC (asphalt concrete). All quadratic multivariate polynomial models with interactions were obtained and validated in order to optimize the responses. Thus, the physical characterization made it possible to obtain an asphalt concrete with good mechanical characteristics. In addition, it was observed that the selected factors had a different impact on the responses, which are: IR/C; the water absorption capacity, compactness and void filled by the binder by significantly increasing or decreasing them in simple, quadratic and interaction contributions. From the multi-response optimization, the objective was to obtain a composite material (Asphalt-PET-Aggregates) with has the best rheological characteristic, resulted in the following compromise: Bitumen rate 7%, PET 6% of asphalt, PET size 0,5mm; Aggregate content 93%. The simulated optimal values yielded the following responses were: 0.77 RI/C, immersion/compressive strength (Y.RI/C); 2.9%, absorption capacity (Y.WAC); 94%, compactness (Y.C); 71% void filled by asphalt (Y.VFA)
    
    VL  - 13
    IS  - 3
    ER  - 

    Copy | Download

Author Information
  • Abstract
  • Keywords
  • Document Sections

    1. 1. Introduction
    2. 2. Materials and Methods
    3. 3. Results and Discussions
    4. 4. Conclusion
    Show Full Outline
  • Abbreviations
  • Author Contributions
  • Conflicts of Interest
  • References
  • Cite This Article
  • Author Information